
http://thereisnoglob...ming-is-a-scam/
cmon bring on the knockers 


Posted 12 April 2014 - 02:04 AM
Oh, for fairy's sake Johnno, give it a stuffing rest.
It's such a shock that a website called thereisnoglobalwarming.com would produce this well reasoned argument that is completely objective, lacking in bias and well sourced, with lots of supporting data. I am so glad that this article is not just (purporting to be) a copy of a letter sent from some guy deep in the throes of alzheimers, (assuming he exists), and categorically proves that you were right all along and all those scientists made it up for shits and giggles so they could go to more conferences.
I look forward to you posting pages from Thisshitisallmadeup.org and bullshitbullshitbullshit.com, as well as ignorantandproud.net.au
Jesus stuffing wept.

Posted 12 April 2014 - 08:31 AM
Things I love about climate deniers:
Posted 12 April 2014 - 12:51 PM
Meh, I've got 5 minutes - I'll bite.
Here's a graph. It depicts the volume of ice in the Arctic Sea, year on year, measured since 1979.

Feel free to explain why the ice volume in the Arctic Sea has decreased by 10,000 cubic kilometres in the past 34 years.
On the other hand, Antarctic Sea area has increased, and volume has increased, but not of a corresponding magnitude. Why?
"The model suggests that overall Antarctic sea ice volume has increased by approximately 30km3/y (0.4%/y) as an equal result of areal expansion (20×103km2/y, or 0.2%/y) and thickening (1.5mm/y, or 0.2%/y). This ice volume increase is an order of magnitude smaller than the Arctic decrease, and about half the size of the increased freshwater supply from the Antarctic Ice Sheet."
http://journals.amet...2RsanUw.twitter
Edited by tunagirll, 12 April 2014 - 12:55 PM.
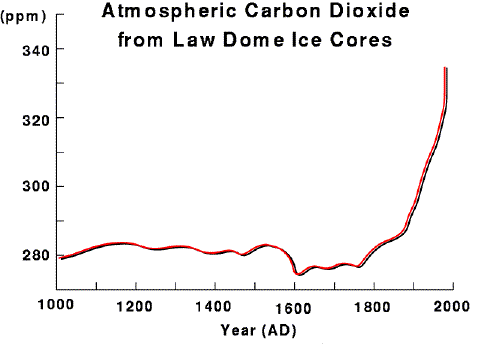
Posted 12 April 2014 - 12:59 PM
Greenhouse Gas levels

These are the hard measured atmospheric figures, no 'scaling' here or fancy footwork or projections. The levels of reference gases to greenhouses gases are listed in the fourth chart.
Any explanation for these rising?
If we focus on CO2, here's AD levels, measured from ice cores. You'll note the ppm corresponds well to atmospheric ppm in our current age. Any suggestion why the timing of CO2 rising might have happened at that point?
"But Silvia," you say. "It was higher in prehistoric times."

Edited by tunagirll, 12 April 2014 - 01:08 PM.


0 members, 0 guests, 0 anonymous users

